Author: Megan Schonhar (Greer Middle College Charter High School)
In the gap years between being a high school student and becoming a high school teacher, I noticed a shift in the definition of writing from being mostly–if not exclusively–text-based to becoming increasingly graphic in nature. This shift, a merging of visual design and written text, is captured in the concept of the infographic, a visual representation of information that typically includes data. Infographics are designed to be clearly and quickly read–in a social media post, on a bulletin board in a community center, or even on the wall of a public restroom.
If we as educators are serious about preparing our students for twenty-first century literacy, we must concede that the texts they use, in both reading and writing, are varied and quite often digitally created. With my freshmen high school students, I decided to merge instruction in reading, research, writing, and design into a unit built around social justice issues. Our tool to communicate important messages about social justice? Infographics!
You may have heard of the various websites that help everyday writers design infographics–the most popular seem to be Piktochart, Infogr.am, and Easel.ly. After creating an account with each site and perusing their options, I chose Easel.ly for my classroom due to its accessibility and free content. While there is an app available through the iTunes App Store, my students used the website on our laptops and Chromebooks.
Creating an account with easel.ly is quite simple: select “sign up free” at the top of the page and then enter your email address and create a password. From the home page, you can either choose a template to start with, or start from scratch by selecting “start fresh.” I encouraged my high school students to start fresh so that they could better customize their infographics.

With a blank canvas, students have the option of choosing a background color/ image and document orientation. Then, there are different categories of objects, shapes, charts, and textbooks Easel.ly offers that students can drag onto their canvases. Another great feature that opens seemingly unlimited options is the “upload” icon, where students can add files to their canvases. Many of my students chose to upload images and charts to their infographics, especially when the precise object needed was not available through the Easel.ly offerings.

Once students have created their infographics, they can save their work to their account and then download the infographic as an image or PDF file. My students downloaded their infographics as PDF files, dropped them in their shared Google Drive folders, and then printed them to display around the school in hard copy. The publication can be easily adapted to digital environments by having them post their work on class websites and/or to social media accounts via link (offered at the top of the project page) or image file.

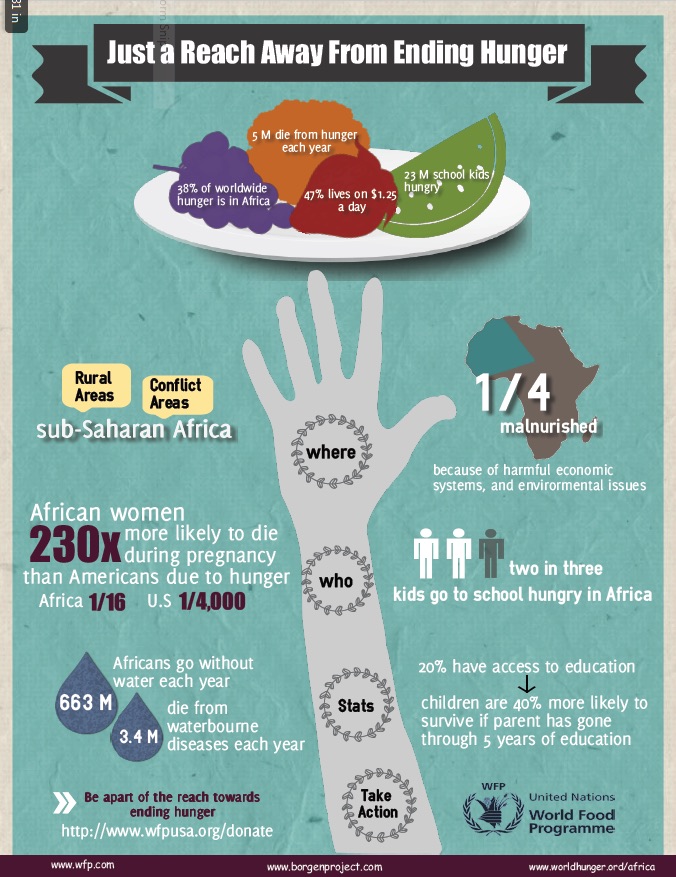
Examples of student infographics on social justice topics
Students were engaged in using the visual and non-traditional medium of the infographic to convey the most important ideas related to their chosen social justice topics. This project gave them the opportunity to learn about credibility of sources, the selection of relevant and discarding of irrelevant information, and the organization of content and text. They were challenged to be concise and incorporate elements of visual art and design. They also had to cite their sources, which helped them to understand the importance of authority and credibility in their scholarship.
A few caveats: You will need to model the easel.ly features to your students. To do so, I created a few sample infographics about easily-accessible topics while they watched and jotted down notes. We also had some conversations about the importance of visual “themes” and using coordinating colors and objects to create unity in the infographic. To help them better understand the genre, we examined numerous mentor texts and discussed their design features. Finally, I implemented a workshop model for this unit so that I could better reach individual students through individual and small-group conferences. Some students will need more help and guidance than others in each major category–design, research, writing, and publication– and conferences enabled me to reach that level of differentiation.
I recommend using Easel.ly in your classroom to help students broaden their literacy horizons!
Megan Schonhar is a high school English teacher in her sixth year of teaching at Greer Middle College Charter High School in South Carolina. She is also a graduate student in the education department at Furman University. Her research interests include teacher and student motivation, instructional technology, and literacy.